The Competitive Intelligence Gold Mine You're Overlooking
Form 20-F filings submitted to the SEC by foreign private issuers contain detailed financial data, risk disclosures, and operational metrics that most analysts overlook. These standardized annual reports from global companies like Toyota, Samsung, and ASML provide granular competitive intelligence unavailable through earnings calls or press releases alone.
As of 2024, over 500 foreign private issuers file Form 20-F annually with the SEC (SEC, 2024), making these filings one of the largest standardized sources of cross-border financial data available to U.S.-based analysts. While many analysts focus on press releases and earnings calls, experienced financial professionals increasingly turn to Form 20-F filings on EDGAR for the granular financial data, strategic insights, and operational metrics these documents contain.
💡 Fun Trivia: Did you know that Form 20-F is used by companies where 50% or less of the total amount of voting shares are held by American Citizens, but its shares can be traded on an American Exchange? This means you can access detailed financial information from global giants like Toyota, Samsung, and ASML—companies that might otherwise be opaque to U.S.-based analysts.
What Makes Form 20-F a Competitive Advantage
Form 20-F is unique in its consideration of the international accounting and reporting standards that may apply to these foreign entities, providing a bridge between diverse regulatory environments and the U.S. financial markets. Under SEC Rule 13a-16 and 15d-16, foreign private issuers must file annual reports on Form 20-F within four months of fiscal year-end, providing standardized data that makes competitive benchmarking more reliable and comprehensive.
As former SEC Commissioner Robert Jackson observed, "Disclosure is the lifeblood of our capital markets," and Form 20-F ensures that foreign issuers contribute to that transparency on a comparable basis to domestic filers.
Step-by-Step Competitive Benchmarking Framework
Competitive benchmarking with Form 20-F data follows three phases: data collection and preparation, financial performance analysis covering profitability and capital efficiency ratios, and strategic intelligence extraction from narrative sections like risk factors and management discussion. Each phase builds on the previous to create a comprehensive competitive picture.
Phase 1: Data Collection & Preparation
The foundation of any robust analysis is high-quality data. Form 20-F ensures you have access to a consistent stream of information.
- Identify Your Competitor Universe: Start by building a list of companies to analyze. Your universe should include:
- Direct competitors filing Form 20-F.
- Adjacent market players who may be encroaching on your space.
- Aspirational benchmarks from other regions or industries that you can learn from.
2. Gather Recent 20-F Filings: Form 20-F must be submitted within a 4-month window at the end of the fiscal year, ensuring you have access to relatively current data.
Real Example: Toyota Motor Corporation consistently files comprehensive Form 20-F reports that provide detailed breakdowns of their automotive and financial services segments, allowing competitors to benchmark everything from R&D spending ratios to geographic market performance. According to a CFA Institute survey on financial reporting quality, institutional investors consistently rank the granularity of annual report disclosures as a significant factor in investment analysis (CFA Institute, 2023).
Phase 2: Financial Performance Analysis
Once you have your filings, the real work begins. Go beyond surface-level numbers to understand the drivers of your competitors' performance.
- **Profitability Analysis: **These metrics reveal how effectively a company is managing its costs and pricing its products.
- **Gross Margin %: **A high gross margin often indicates strong pricing power and efficient production.
- EBITDA Margin %: This metric is a powerful indicator of a company's core operational efficiency, before the impact of financing and taxes.
- Net Margin %: This shows overall profitability after all expenses are accounted for, highlighting superior cost management.
2. Growth Analysis: Look at where and how your competitors are growing to understand their strategic focus.
- **Revenue CAGR **(Compound Annual Growth Rate): This indicates sustained market share gains.
- Segment Growth: Breaking down revenue by business segment reveals which product lines or services are driving growth and where a company is focusing its resources.
- Geographic Growth: Analysis of revenue by region can identify a competitor's market expansion strategy and potential areas of intense competition.
3.** Capital Efficiency:** These ratios measure how well a company is using its assets to generate returns.
- **ROIC **(Return on Invested Capital): A high ROIC indicates that a company is generating strong returns from the capital it has invested in the business.
- ROE (Return on Equity): This metric shows how effectively a company is using shareholders' equity to generate profits.
- Asset Turnover: This tells you how efficiently a company is using its assets to generate sales.
Phase 3: Strategic Intelligence Extraction
The quantitative analysis is just the beginning. The real competitive advantage comes from extracting qualitative insights from the narrative sections of the Form 20-F.
- Risk Factor Analysis: Form 20-F filings contain detailed risk factor discussions that can reveal your rivals' deepest concerns and vulnerabilities. Look for mentions of:
- Competitive threats they are most concerned about.
- Market vulnerabilities they are actively addressing.
- Regulatory challenges affecting the entire industry.
- Technology disruption concerns and their plans to mitigate them.
2.** Investment Priority Mapping:** The "Management's Discussion and Analysis" section is a goldmine for understanding a competitor's strategic roadmap. Read between the lines to identify their key investment priorities, such as:
- R&D investment priorities and a focus on new technologies.
- Geographic expansion strategies.
- Digital transformation initiatives.
- Sustainability investments and their approach to ESG (Environmental, Social, and Governance) factors.
Advanced Benchmarking Techniques
Advanced 20-F benchmarking goes beyond single-year snapshots by using multi-year trend analysis to track competitive positioning over time and segment-level deep dives to examine product line profitability, geographic performance, customer concentration risks, and supply chain dependencies. Foreign issuers often provide more granular segment data in 20-F filings than domestic companies include in 10-K reports.
A Deloitte analysis of foreign private issuer reporting notes that 20-F filings often include more granular segment disclosures than domestic 10-K filings, partly because IFRS segment reporting standards require different levels of detail (Deloitte, 2024). To move from basic analysis to strategic intelligence, a deeper dive into the Form 20-F is required.
- Multi-Year Trend Analysis: A single data point is not enough. The true story of a company’s performance is revealed through its multi-year trajectory. By analyzing a company's competitive position over time, you can identify patterns of improvement or decline. This allows you to understand the effectiveness of their past strategic decisions and anticipate future moves.
- Segment-Level Deep Dives: Foreign companies often provide more detailed segment reporting in their 20-F filings than domestic competitors provide in 10-Ks. This level of granularity gives you critical insights into:
- Product line profitability
- Geographic market performance
- Customer concentration risks
- Supply chain dependencies
How AI Tools Accelerate 20-F Analysis
AI-powered tools can automate the extraction of financial metrics from multiple 20-F filings, standardize data formats for cross-company comparison, generate peer group rankings with statistical significance, and perform natural language analysis of management commentary and risk factor trends. This reduces weeks of manual work to hours.
As SEC Chair Gary Gensler noted in a 2023 speech on AI and markets, "Technology has always been a part of our markets, and artificial intelligence tools hold the potential to increase efficiency and access." Applied to regulatory filings, AI can transform the speed at which analysts extract competitive insights from standardized documents like 20-F.
Traditional manual analysis of Form 20-F documents is time-consuming and prone to oversight. AI-powered platforms address this through three capabilities:
Automated Data Extraction
- Extracting key financial metrics across multiple companies
- Standardizing data formats for cross-company comparison
- Identifying year-over-year changes automatically
Intelligent Benchmarking
- Creating peer group comparisons with statistical significance
- Generating industry percentile rankings
- Highlighting outliers and anomalies requiring deeper investigation
Strategic Insight Generation
- Natural language analysis of management commentary
- Risk factor trend identification
- Investment theme extraction across competitor set
Action Items: Implementing Your 20-F Benchmarking Strategy
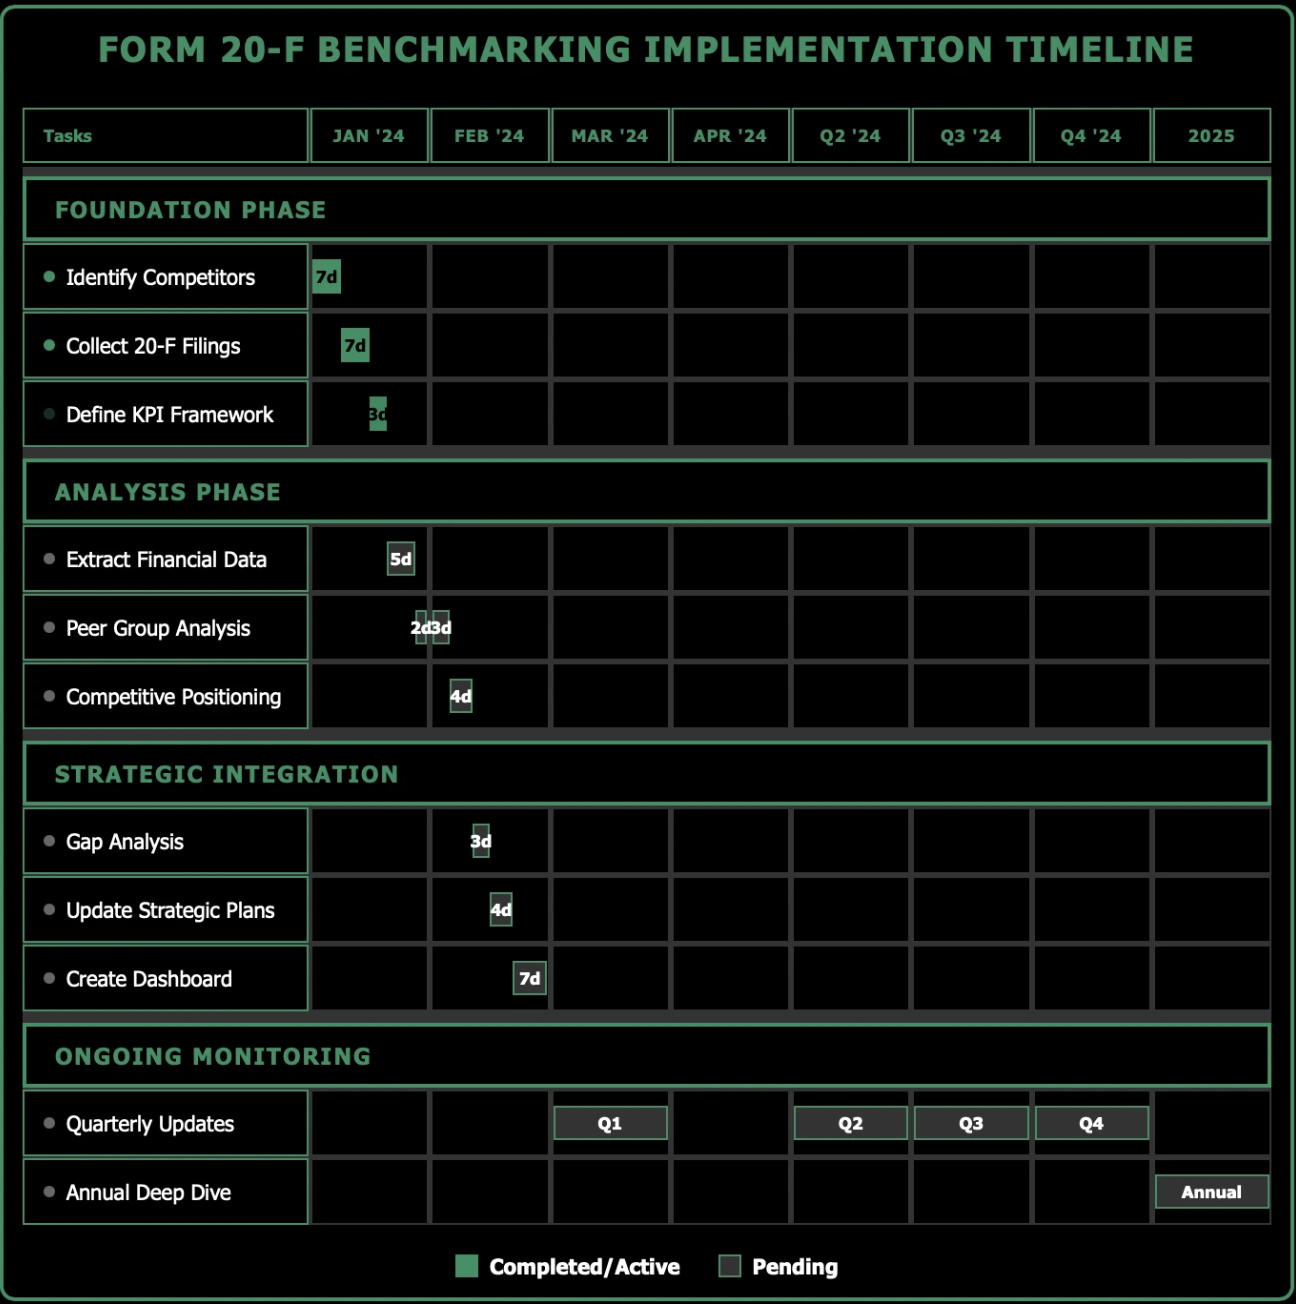
Implementation Checklist:
Week 1-2: Foundation Building
- Identify 8-12 key competitors filing Form 20-F
- Collect most recent 3 years of filings
- Define your benchmarking framework and KPIs
Week 3-4: Analysis Phase
- Extract and standardize financial metrics
- Conduct peer group statistical analysis
- Map competitive positioning across key dimensions
Week 5-6: Strategic Integration
- Identify competitive gaps and opportunities
- Update strategic planning assumptions
- Create ongoing monitoring dashboard
Ongoing: Continuous Intelligence
- Monitor quarterly updates and amendments
- Track changes in risk factor discussions
- Update benchmarks as new filings become available
Pro Tips from the Experts
Experienced 20-F analysts focus on three key areas: Item 5 (Operating and Financial Review) for forward-looking management insights, cross-referencing 20-F data with local market filings to identify reporting discrepancies, and tracking new SEC climate reporting requirements beginning fiscal year 2025 for ESG benchmarking opportunities.
Advanced Tip #1: Pay special attention to "Item 5: Operating and Financial Review" in Form 20-F filings. This section often contains forward-looking statements and management insights that aren't available in other public documents.
**Advanced Tip #2: **Cross-reference Form 20-F data with local market filings (if available) to identify reporting differences that might signal strategic priorities or regional focus areas.
Advanced Tip #3: Large accelerated filers starting in the fiscal year beginning 2025 may need to comply with new SEC climate reporting rules, creating new benchmarking opportunities around ESG metrics. PwC's 2024 Global Investor Survey found that 75% of institutional investors consider ESG reporting a significant factor in investment decisions (PwC, 2024).
Why Form 20-F Matters More Than Ever
In an increasingly global business environment, competitive intelligence cannot be limited to domestic players. Form 20-F filings provide standardized, comprehensive insights into international competitors that are often more detailed than what domestic companies provide in their 10-K filings.
In an increasingly global business environment, competitive intelligence that includes foreign private issuers provides a more complete picture of the competitive landscape. According to KPMG's 2024 CEO Outlook, 76% of global CEOs cite cross-border competitive dynamics as a top strategic concern (KPMG, 2024). Automating the extraction and standardization of 20-F data reduces analysis time from weeks to hours, allowing teams to focus on strategic decision-making rather than data processing.